
The Analytics Capstone Course (Summer 2023)
| Program Overview | ||
|---|---|---|
| Program Title | The Analytics Capstone Course (Summer 2023) | |
| Organization | University of South Carolina - Upstate | |
| Student Application Link | https://uscupstate.capsource.app/program/the-analytics-capstone-course-summer-2023/rfp | |
| # of Students Enrolled |
0
|
|
| # of Projects Running |
1 Project/s Added (of 1 Project Expected)
|
|
|
Program Timeline Project Duration |
Start Date: 05/01/23 End Date: 06/12/23 1 month |
|
| Collaboration Overview | ||
|---|---|---|
| About Students |
The Analytics Capstone Course provides students with an opportunity to apply their collective knowledge and skills in analytics to solve challenging problems. Students are skilled at cleaning and organizing data, predictive and prescriptive analytics, and visualization in Tableau.
Student Level: Student Time Commitment: Full Time Team Structure: 1 - 5 |
|
| Program Goals | The learning objectives for the course are the following:
|
|
| Format Structure |
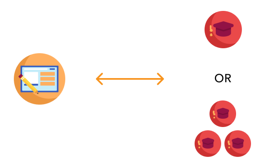
Single Project Single Team |
|
| Format Title | Multiple Projects Multiple Teams | |
| Format Description | ||
| Benefits For Industry Partners | ||
| Project Modality | Fully Remote | |
| Industry Partner Requirements to Participate | ||
|---|---|---|
| Project Topics | Data Management Operations Quality Control Reporting, Financial Planning & Analysis Research & Development | |
| Target Industries | Aerospace & Defense Agriculture & Farming Arts & Recreation Biotech & Pharmaceuticals Computers & Hardware Construction, Repair & Maitenance Consulting & Professional Services Consumer Products & Services Education & Ed-Tech Energy & Utilities Fashion & Apparel Finance & Investment Food & Beverage Government Health Care & Life Sciences Insurance Manufacturing & Industrial Media, Publishing & Content Natural Resources Non-Profit & Social Impact Real Estate Restaurants, Bars & Food Services Retail & E-Commerce Software, AI & Data Sports & Entertainment Telecommunications Transportation & Logistics Travel & Tourism | |
| Skills & Expertise | Data Entry Data Processing Data Visualization Database Administration Database Development | |
| Location Information & Preferences |
Local (within 30 miles) Located Anywhere Regional (within 90 miles) |
|
| Sponsorship |
No Sponsorship Required |
|
| Compensation |
Following compensation will be offered to the students:
Exactly $0.0 per hour |
|
| Other Requirements | ||
| Expected Time Commitment For Project Managers | 2 Hours per week | |
| Key Program Dates | Due Date |
|---|---|
|
Request for Proposal published
Collaboration request published. Industry Partners may express interest in participating.
|
Apr 12 2023, 03:33 PM UTC |
|
Interview
Educators will begin interviewing interested Industry Partners to discuss project ideas.
|
Apr 13 2023, 03:33 PM UTC |
|
Proposal Application Deadline
Final date for Industry Partners to express interest in participating.
|
Apr 25 2023, 03:33 PM UTC |
|
Finalize Project Charter
Educators and Industry Partners finalize project charters, legal documents, and background materials.
|
Apr 27 2023, 03:33 PM UTC |
|
Official Program Launch
We’ll find a time on this day for you to meet with the students to kick off your project.
|
May 01 2023 |
|
Official Program End
We’ll find a time on this day for you to meet with the students to wrap up your project.
|
Jun 12 2023 |
Project Overview
| Project Details | |
|---|---|
| Project Title | Realogic Analytics |
| Project Synopsis |
What is the challenge or opportunity you are trying to address within your organization? We are currently in the process of creating a data warehouse for the entire organization (all divisions). The goal is to pull all the various data sources: operations, finance, HR, social media and put in one place. We're also thinking of pulling relevant external data sources. Even before the data warehouse is fully populated, we've started created reports and dashboards that give us a real-time (or near real-time) picture of how the company is doing on all fronts. This work has barely started but there's still a lot to do. Once the data is all there, we are planning to create more advanced reports and products that leverage it in ways that require multiple sources (for example, automated way to schedule nurses for facilities).
What are some of the activities or action items you think will need to be taken to achieve your desired results? From a high level our goal is to allow us to see where the various departments in the organization are in real time. In terms of specifics, we would like to create a set of analyses (dashboards, reports, visualizations) that leverage the existing data and allow us to understand where things are. We currently have three data sources in the warehouse (and adding more):
For example, one interesting question would leverage the LinkedIn page data and would aim to answer "How are our engagement levels looking, month to month, across every criteria - likes, shares, comments - for every one of the pages?" "Are there any trends that seem to affect engagement?" What would make this project a success for your organization? What measurable results are you looking to accomplish? Ideally, this project will create analyses that truly represent where the organization is. The goal would be to create something that our staff will find useful and want to engage with, and more so, want to make an integral part of their work. Furthermore, if this project could help shed some lights on elements that may not be obvious and our staff may not be aware of, this would truly be a win. In terms of measurable results
|
| Compensation |
Following compensation will be offered to the students
Exactly $0.0 per hour |
| Sponsorship |
No Sponsorship Required |
| Resources |
Program Timeline
|
Due Date
|
Activities |
Deliverables
|
Status
|
Action | |
|---|---|---|---|---|---|
|
Sun, 04/30/23
12:00 PM
UTC
|
Required Deliverable
|
Required Deliverable
Deliverable submission is required.
|
|||
|
Description:
Hello Udi, I think this is a good project. The key is to study your data for visualizations and dashboards. Can you please share the dataset (even if it is small and incomplete)? We can also view multiple data sets and their interconnections on a dashboard. Thank you!
|
|||||
|
Mon, 05/01/23
|
Program Kickoff
|
No Deliverables
No deliverables are required for this action item.
|
|||
|
Location:
|
|||||
Projects
| Project | Organization | Topics |
|---|---|---|
| Realogic Analytics | Realogic Solutions | Data Management Operations Reporting, Financial Planning & Analysis Research & Development |
Program Managers
| Name | Organization |
|---|---|
| Uma Gupta | University of South Carolina - Upstate |
Teams
| Team Name | Project Name | Team Members |
|---|---|---|
| No Teams Available |